Decision Making in the Age of Information Abundance: Less Data, More Wisdom
Key takeaways
Narrow the decision before expanding the data—if the core question can’t be stated in one sentence, more metrics will only add drag.
Define “decision-grade inputs” (a small set of trusted measures with owners, definitions, and refresh cycles) to stop debating which numbers are real.
Turn dashboards into instruments by using thresholds and pre-agreed actions so data triggers decisions instead of presentations.
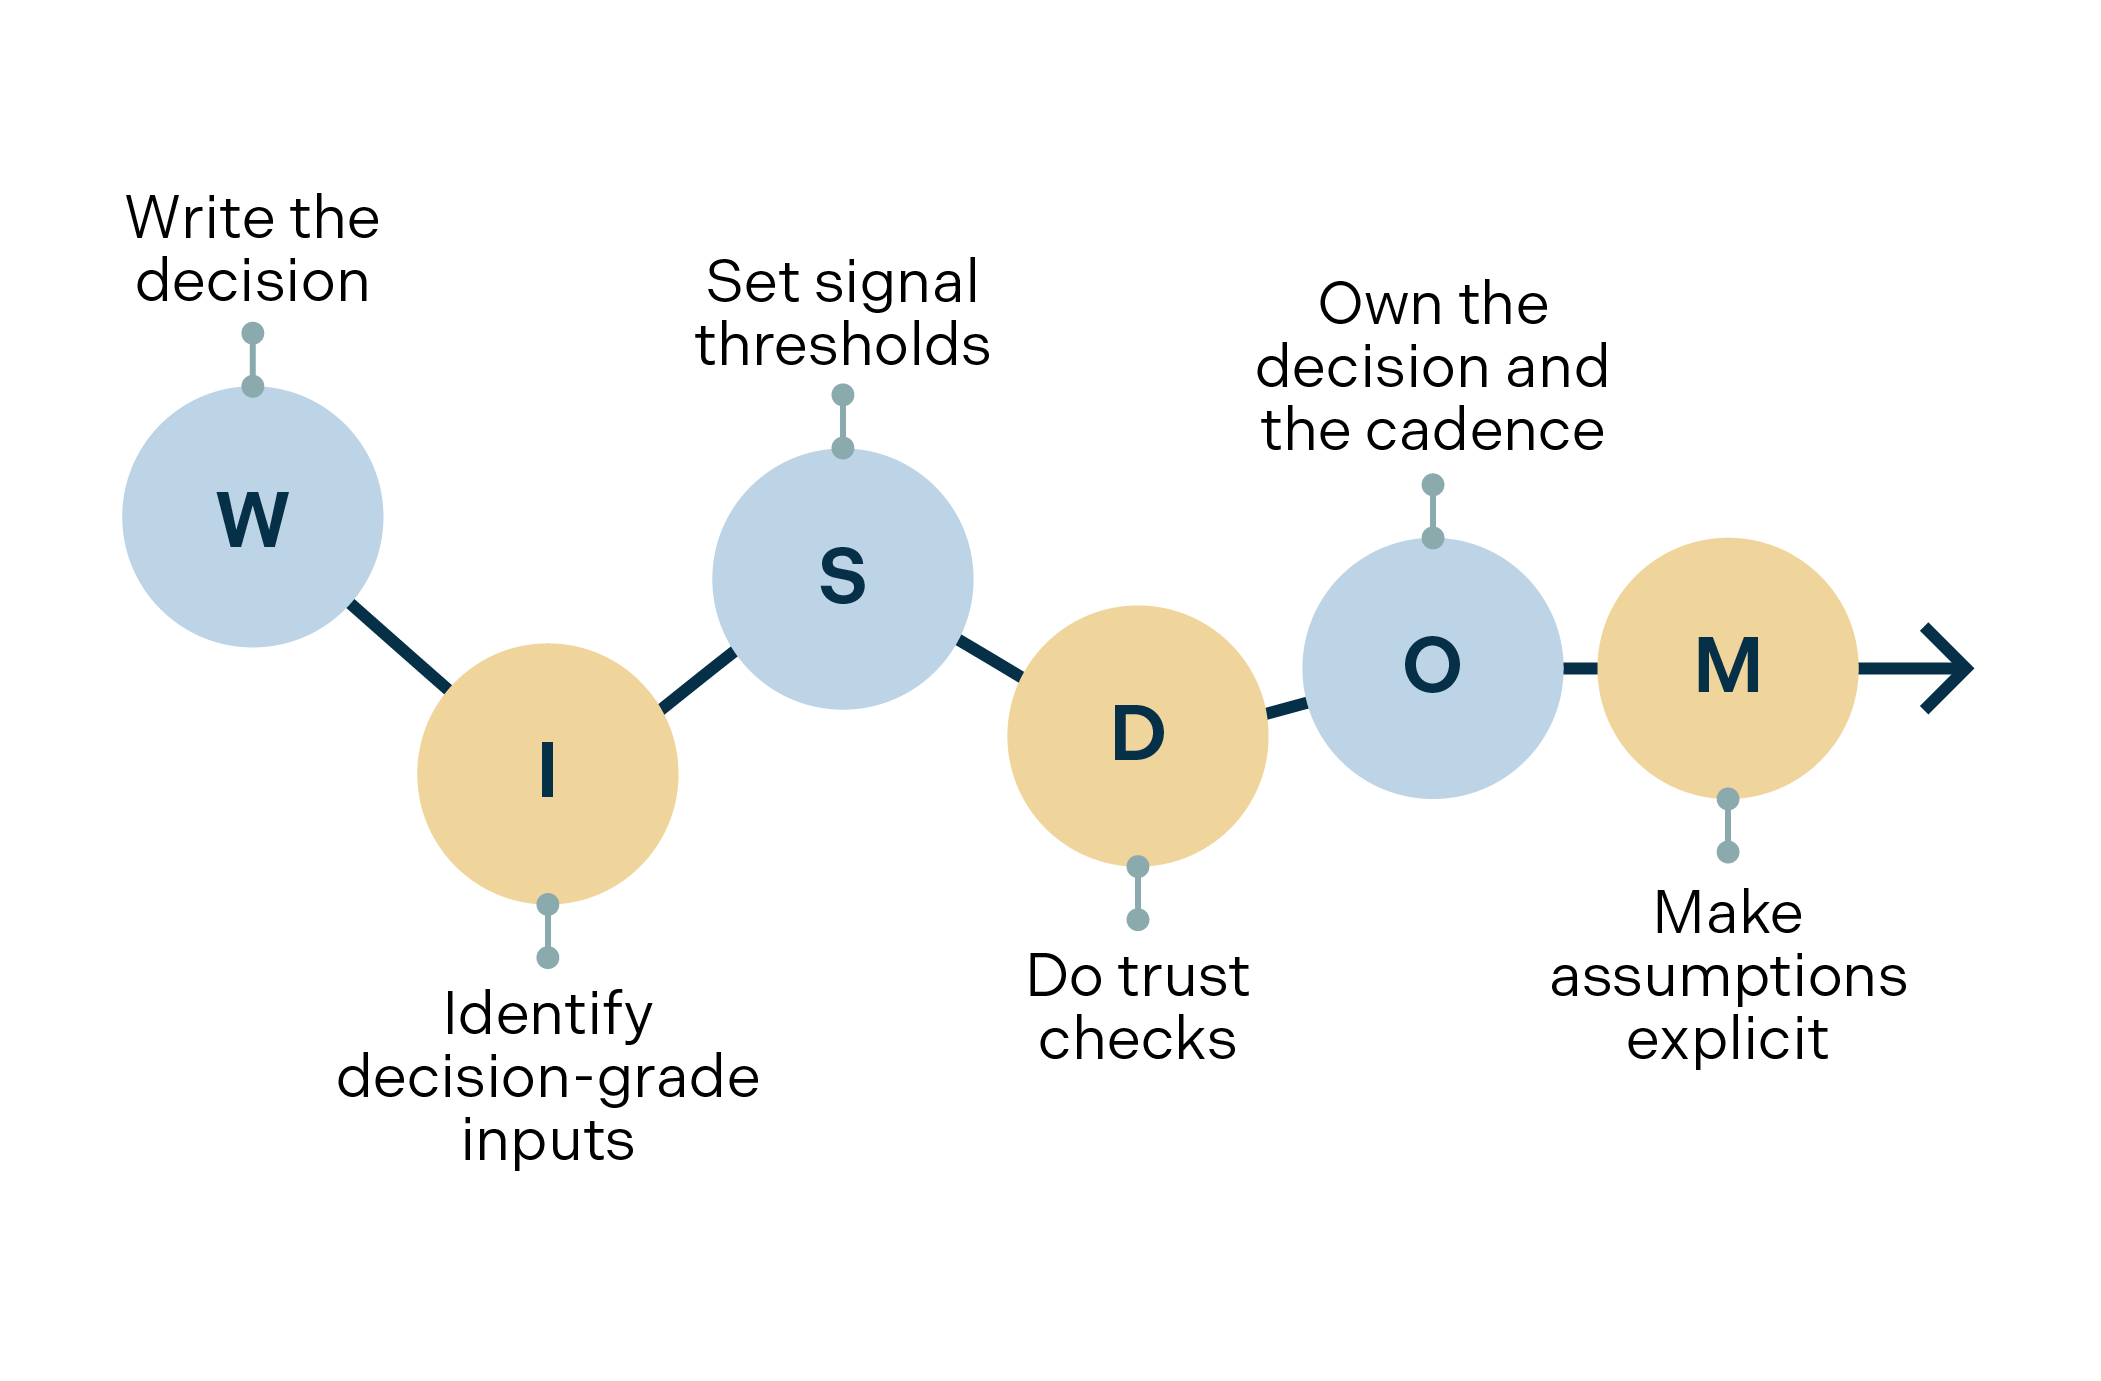
Make judgment auditable with WISDOM (What decision, Inputs, Signal thresholds, Data trust checks, Ownership cadence, Make assumptions explicit) so choices don’t get re-litigated.
Leaders today rarely lack information. They lack closure.
In many organizations, decision-making has acquired an unproductive new phase: debating which dashboard is “right,” which definition is “official,” and which number should be trusted. When confidence is low, the reflex is predictable—pull in more metrics, more stakeholders, more meetings. The result is a familiar paradox: more reporting, slower decisions, and weaker accountability.
The trust gap is not theoretical. A 2025 survey of data and analytics professionals found that 67% don’t fully trust the data their organization uses for decision-making. And the cost of poor data quality is not marginal: Gartner estimates it costs organizations $12.9 million per year on average.
In data-rich environments, advantage shifts from accumulation to discernment: less data, more wisdom.
Share
What’s Changing
Three shifts are reshaping how decisions get made:
Data is abundant; attention is scarce. Reporting can expand indefinitely. Leadership time cannot.
Decisions are more interconnected. Choices now cross functions, entities, and geographies. Inputs multiply, and so do dependencies.
Governance expectations are rising. Boards and senior teams increasingly need decisions that are defensible and repeatable —not just “felt right.”
The implication is straightforward: decision quality is becoming an operating capability, not a personal trait of a strong leader.
The Real Problem Leaders Underestimate: Signal Ambiguity
“Data overload” is too generic to diagnose. The sharper board-level issue is signal ambiguity: too many metrics, inconsistent definitions, and unclear ownership of what constitutes truth.
When signal ambiguity sets in, four symptoms show up quickly:
Metric sprawl: multiple versions of the same KPI exist across finance, operations, and commercial teams.
Decision theater: dashboards are reviewed meticulously, yet decisions don’t change—or they reappear next week.
Slow escalation: disputed inputs become a socially acceptable reason to avoid committing to trade-offs.
Quiet risk accumulation: weak data quality hides operational issues until they become incidents.
This is why “more data” often produces less movement. Without narrowing and trust, abundance becomes drag.
Here is your content in normal clean format, no left gap, properly spaced and structured:
The WISDOM Model: A Discipline for Decision Quality
The fix is not “fewer dashboards” as an aesthetic preference. The fix is a repeatable discipline that tightens the link between evidence and action. Use WISDOM as a practical operating model for decisions:
• W — Write the decision State the decision in one sentence. If you can’t write it cleanly, more data won’t help—it will only broaden debate.
• I — Identify decision-grade inputs Agree the minimum viable set of inputs you will trust enough to act on, often a small set of core metrics. For each input, define: owner, definition, refresh cadence, and “as of” timing. This is how you reduce the trust gap that data professionals report.
• S — Set signal thresholds Dashboards should not merely inform; they should trigger. Define green/yellow/red thresholds and attach a playbook to each state. If a metric turns red, you should not need an emergency meeting to decide what to do.
• D — Do trust checks Make confidence visible: freshness flags, exception reporting, and known limitations. This shifts meeting time away from arguing about validity and toward choosing trade-offs.
• O — Own the decision and the cadence Most decision confusion is role confusion. Define who decides, who advises, and how often the decision is revisited. Without cadence, decisions drift away from the assumptions that justified them.
• M — Make assumptions explicit Capture assumptions and trade-offs on one page. This is where human judgment becomes transparent, discussable, and revisitablemes auditable—so decisions don’t get re- litigated and learning becomes possible when outcomes differ from expectations.
WISDOM doesn’t remove intuition. It professionalizes it—by making judgment explicit and testable.
What Good Looks Like
When WISDOM is working, the shift is visible in behavior:
From dashboards as artifacts → dashboards as instruments. Metrics trigger action, not narration.
From debating the number → debating the trade-off. Time moves from data disputes to strategic choice.
From intuition vs. analytics → judgment with written assumptions. Human insight stays central, but becomes explicit.
From recurring agenda items → closed decisions. The same decision doesn’t return repeatedly because rationale, ownership, and revisit triggers are clear.
A simple diagnostic: if the same decision appears on the agenda repeatedly, you likely have an input problem, definitions or trust, or an ownership problem, decision rights or cadence.
Your issue is spacing and alignment. The bullets are sticking to the title because there is no proper line break and indentation.
Here is the clean, properly structured version. Copy and paste:
How to Execute
Start practical. No enterprise-wide “data transformation” required.
• Choose three high-friction decisions Pick recurring decisions that consume disproportionate leadership time, pricing, capex, vendor selection, hiring.
• Create a metric contract for each decision Define decision-grade inputs and lock definitions, ownership, and refresh cadence.
• Add thresholds and playbooks Move from descriptive reporting to action triggers. Define what “red” means and what happens next.
• Instrument trust Add freshness indicators and exception flags. Reduce shadow reporting by making quality visible.
• Use one-page decision logs Record the decision, assumptions, trade-offs, and revisit triggers. This creates institutional memory, especially valuable where leadership changes or work spans multiple entities.
• Run a monthly signal review Retire metrics that don’t trigger decisions. Add new ones only when tied to a specific decision and threshold. This is how you control sprawl.
If this is for Webflow and spacing still looks uneven, tell me. I will give you the exact CSS fix.
Risks and Trade-Offs
Over-narrowing: focusing too tightly can miss weak signals. Keep a separate “watchlist” that informs without triggering action.
False confidence: clean dashboards can hide biased definitions. Periodically audit KPI definitions and align cross-functionally.
Cost of bad inputs: poor data quality creates real economic waste and misallocation at scale. Treat trust and definitions as leadership work, not a back-office fix.
Leadership Questions
Which decisions are slow because we don’t trust the inputs?
Where are we using more data as a substitute for clear ownership?
Which metrics merely describe—and which metrics trigger action?
What assumptions drive our biggest decisions, and are they written down?
If we cut our dashboards in half, what would we keep—and why?


.svg)