A digital service can become faster for everyone who completes it while remaining out of reach for people who never make it through the first step. If measurement begins at login, exclusion has already happened outside the dashboard.
Key takeaways
Digital public services should be measured from the population they are intended to serve, not only from the transactions the platform can observe.
Connectivity is one exclusion point among several. Discovery, identity, language, accessibility, payment and error recovery can each determine whether a citizen receives the service.
Assisted access can be part of good digital-service design in Africa rather than evidence that digitization has failed.
A program director reviewing a newly digitized public service sees the people the platform can record. Successful transactions are visible, failed authentication attempts can be counted and abandoned applications can be traced. The hardest citizen to measure is the one who never creates an observable digital event. No abandoned transaction, no failed payment, no record at all. Discovery, connectivity, identity, language, accessibility or confidence ended the journey before the platform began to watch.
The digital queue did not disappear. Part of it moved outside the dashboard.
Digital public services are measured from the platform outward. Inclusion has to be measured from the intended population inward. The denominator begins with the people the service exists to serve, not with the first transaction the system can see.
Share
Coverage is not use
Across the ITU Africa region, the gap between network availability and actual use remains substantial. ITU’s 2025 assessment reports that 38% of the population used the Internet in 2024, while mobile broadband networks covered 86% of the population. Internet use reached 57% in urban areas and 23% in rural areas, the widest urban-rural gap among ITU regions.
Those numbers expose an important distinction. A network can cover a person without that person becoming an active digital user.
The same variation appears within countries, and the Kenyan data show it at three levels. A joint Kenya National Bureau of Statistics and Communications Authority survey, covering more than 25,000 households across all 47 counties, reports household mobile phone ownership at 93.8% nationally. Household internet access, a different measure, stood at 36.3%. Individual internet use was 35.0% nationally, 56.6% in urban areas and 25.0% in rural areas. [2] The survey also found greater digital exclusion among people living with disabilities, older people and those with limited schooling.
Three indicators, three different pictures of the same population. Almost every household can reach a phone. Roughly one in three has internet access at home. Roughly one in three people used the internet at all.
None of these figures measures access to a particular public service, and they do not need to. They establish the fact a service designer or funder has to work around: intended users approach the same digital service from very different starting conditions. A network that covers a citizen has not yet delivered a service to that citizen.
Start before the platform does
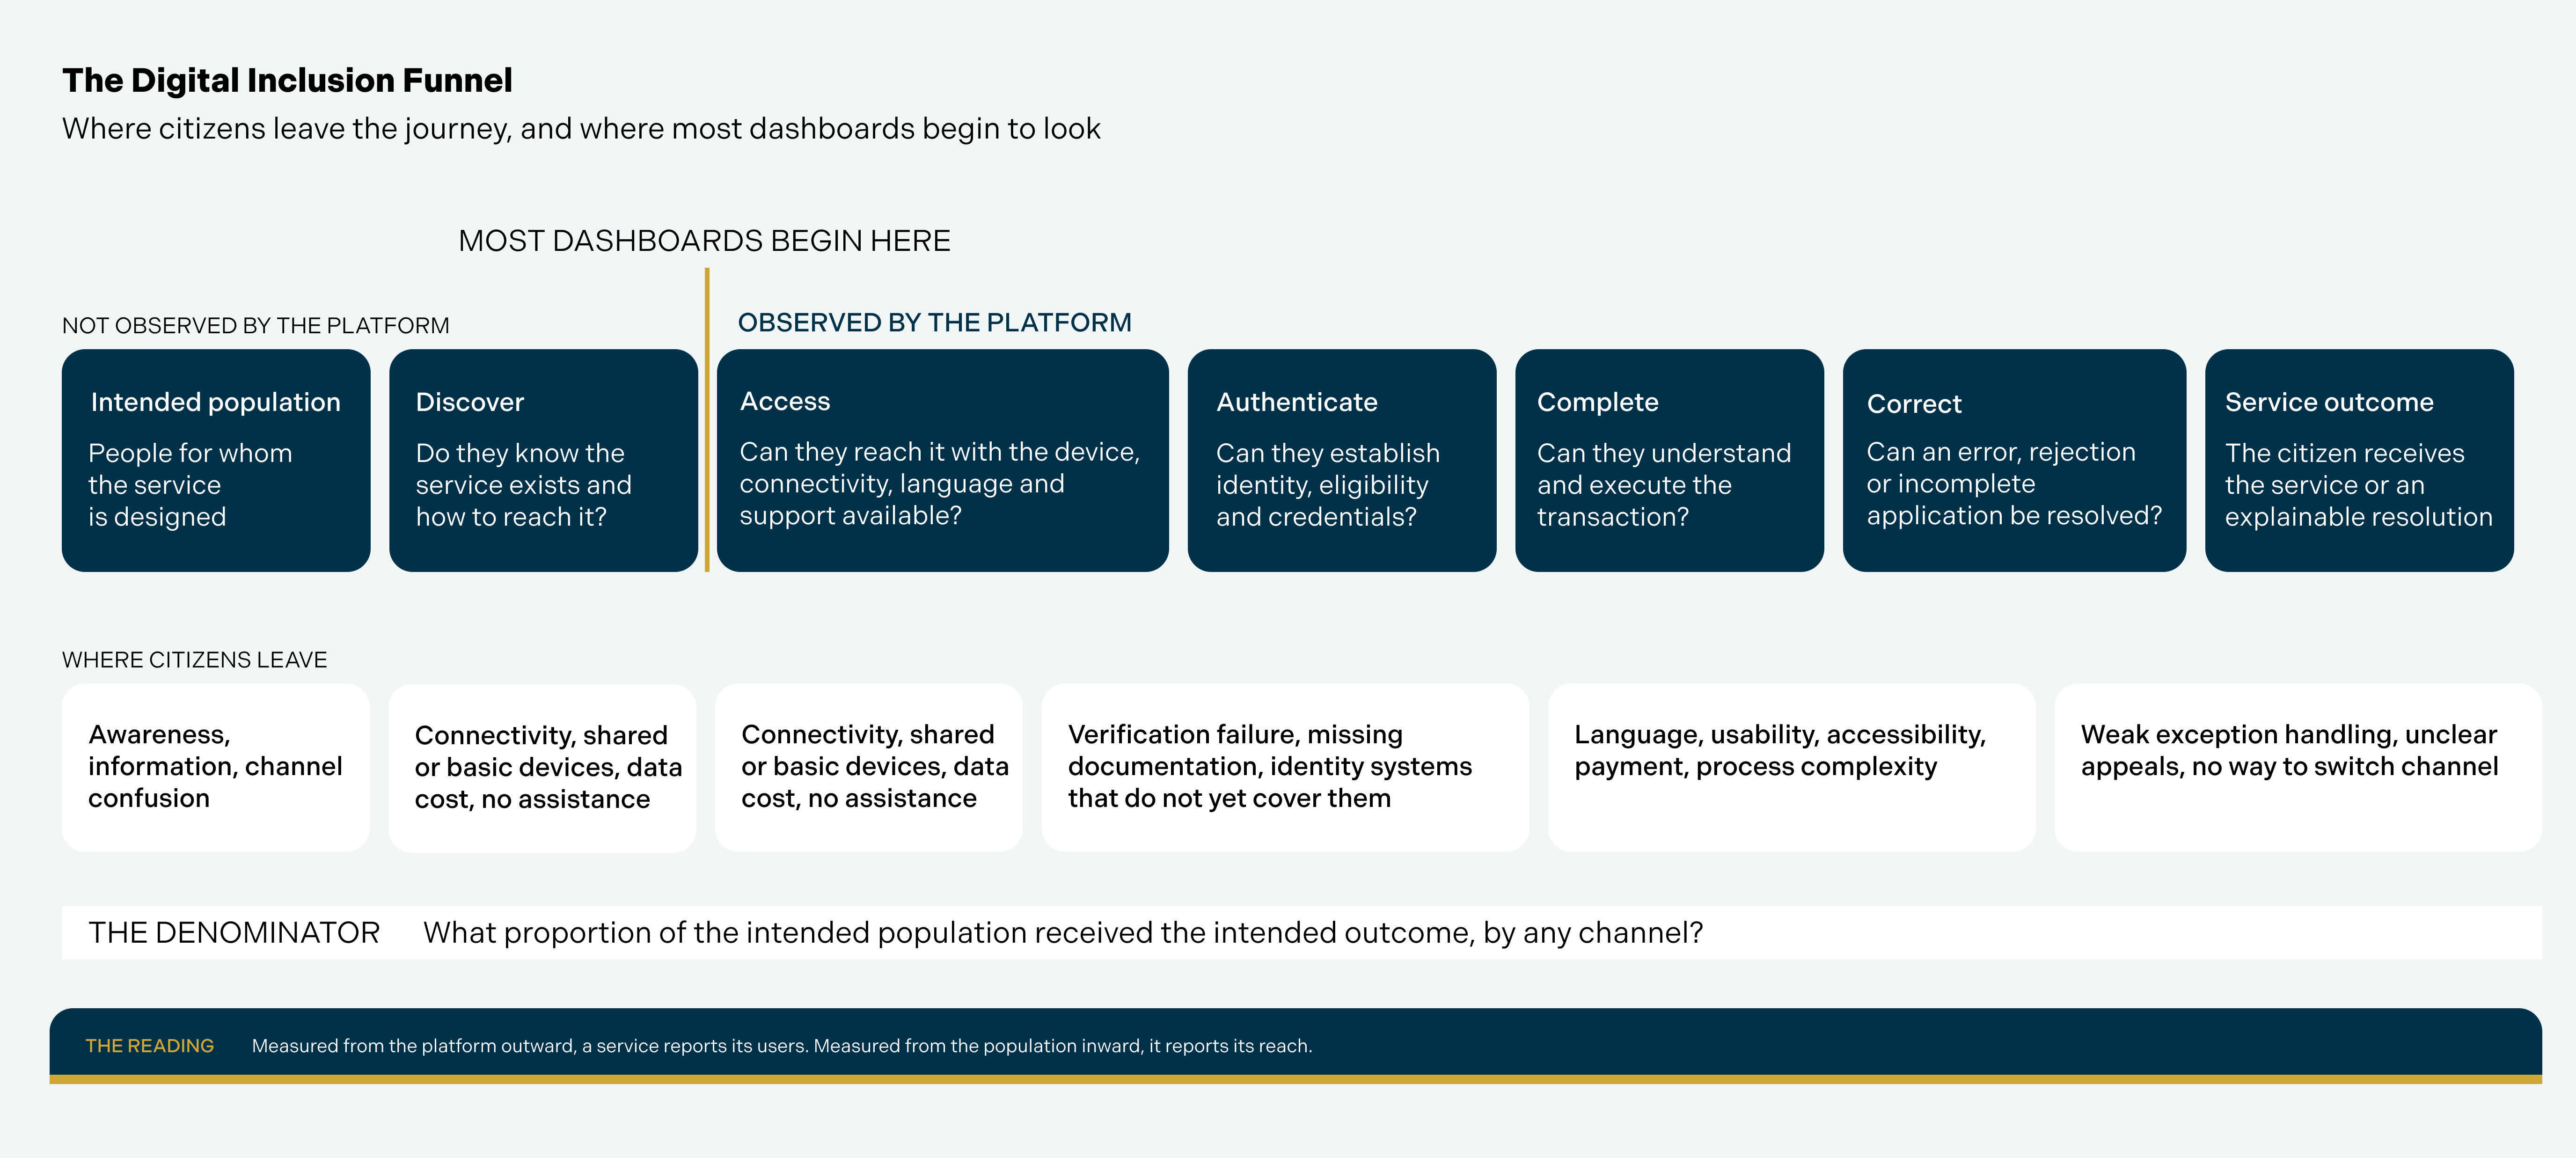
The Digital Inclusion Funnel, our service-design lens, extends measurement to where the intended population begins, rather than where the system starts recording activity.
Each stage can take a different form across African markets. Access may involve a shared handset, a feature phone, voice or USSD rather than an app. Authentication can become a major constraint where digital-identity coverage is incomplete. Completion may depend on language, accessibility and a payment ecosystem that includes both digital and assisted channels.
A dashboard that reports a strong completion rate among authenticated users is therefore reporting on the narrower end of the funnel. It cannot describe the citizens who never discovered the service, could not reach it, failed verification or needed another person to continue.
Assisted access is architecture, not exception
Africa’s experience with digital financial services offers a useful precedent. IFC and the Mastercard Foundation report on their Partnership for Financial Inclusion, which worked with 14 African financial-services providers from 2012 to 2016. It resulted in 7.2 million new registered digital financial-services users and 45,000 new banking agents. In its broader discussion of digital financial services, the report describes agents as crucial to delivery: they enable cash-in and cash-out, and can sign up, onboard and educate customers.
The lesson for public services is not that the two sectors are identical. It is that a digital transaction can depend on a human layer that helps people enter, navigate or recover from the process. A citizen may begin online and need help resolving an identity issue. Another may start at a service center and complete digitally. A user with limited literacy or an accessibility need may require a different interface or human support at one stage of the journey.
Assisted access is not the opposite of digital delivery. In some services, it is the architecture that makes digital delivery inclusive.
This distinction matters because performance measures can otherwise reward the wrong behavior. Removing assistance can make a digital channel appear cleaner while pushing legitimate users outside the measurable system. The management questions are how often assistance is needed, at which stage, and whether the same barriers repeatedly affect the same populations. Access infrastructure and citizen access are related measures; they are not the same measure.
Three ways a digital service can look successful and not be
A service can report well and still fail the people it exists for. It does so in three distinct ways, worth separating because they have different fixes.
Coverage without use. The infrastructure reaches the population and the population does not become users. This is an access and affordability problem, and it sits largely outside the service.
Completion without inclusion. The people who reach the service complete it at a high rate, and they are a narrow and unrepresentative slice of the intended population. This is a design problem inside the service, in discovery, identity, language or channel.
Transaction without outcome. The transaction completes, the dashboard records a success, and the underlying need remains unresolved. An application is submitted and never adjudicated. A payment is recorded and never received. An error is logged and never corrected.
The third should worry a program director most, because it is invisible precisely where the data looks best. Every observable signal is positive.
All three share one cause. The service is being measured by what the platform can observe, and the platform can only observe the people it has already reached. There is a single measure that closes the gap, and it is uncomfortable because it puts a much larger number in the denominator.
What proportion of the intended population received the intended outcome, by any channel?
The denominator is the population the service exists to serve, not the users who arrived. The numerator counts the outcome, not the transaction. And "by any channel" does the quiet work: digital completion, assisted completion and hybrid journeys all count, because from the citizen’s position they are the same event. That resolves the assisted-access argument without needing to defend it. Assistance stops looking like leakage and becomes one of several routes to the same result.
Change what success means
For governments, the implication is to report service outcomes alongside transaction statistics. The number of services digitized and completed transactions remain useful measures, but they should sit beside evidence on attempted access, assisted completion, unresolved cases and repeated points of failure.
For development partners, programs that fund digitization should distinguish between placing a service online and extending usable access to the population they intend to benefit. That means understanding who is reached, who needs support and who remains outside the observable system.
For development finance institutions, the same principle should shape the assessment of digital infrastructure and public-service investments. Infrastructure utilization and transaction growth matter, but the development case becomes stronger when those investments can be connected to access and service outcomes for intended users.
None of this requires every program to become a social-research exercise. Start with consequential services and populations for whom failure carries the greatest cost. Trace where users disappear, establish why, and determine whether the response belongs in the service, the surrounding infrastructure or the assisted-access model.
Africa’s next phase of digital public-service development will not be defined only by how many services move online. There is an opportunity here to set a stronger standard. Count the intended population first, treat assisted access as design rather than failure, and judge the service by who received the outcome.
If the dashboard begins with the citizens who successfully entered the system, it begins too late.
Questions for leadership
Which intended users are absent from our service data because they never reached the first observable transaction?
At which stage of the journey do citizens most often need another channel, person or exception to continue?
Are we measuring digital activity, or whether the intended population received the service outcome?
Share
References
International Telecommunication Union (2025). State of Digital Development and Trends in the Africa Region: Challenges and Opportunities. Reports 38% Internet use in the ITU Africa region in 2024, 57% urban and 23% rural use, and mobile broadband coverage of 86% of the population. itu.int
Kenya National Bureau of Statistics and Communications Authority of Kenya (2025). Analytical Report on ICT Based on the 2023/24 Kenya Housing Survey. Covers more than 25,000 households across all 47 counties. Reports household mobile phone ownership of 93.8%, household internet access of 36.3%, and individual internet use of 35.0% nationally, 56.6% urban and 25.0% rural. The survey examines ICT ownership and usage by geography, income, education, age and disability. knbs.or.ke
International Finance Corporation and Mastercard Foundation (2018). Digital Access: The Future of Financial Inclusion in Africa. Partnership for Financial Inclusion. Reports that the Partnership for Financial Inclusion, working with 14 African financial-services providers from 2012 to 2016, resulted in 7.2 million new registered digital financial-services users and 45,000 new banking agents. The report separately describes agents as enabling cash-in and cash-out and as able to sign up, onboard and educate customer enrollment and cash-in and cash-out. The analogy in this article illustrates assisted-access architecture; it does not equate financial services with public-service delivery. ifc.org



.svg)